Net Neutrality Monitor analyses how Internet Service Providers resolve, block and inject DNS traffic. The platform tracks servers under examination, surfaces country-level reports, and publishes a live blacklist of injected addresses.
View Country ReportsWhat the platform does
Net Neutrality Monitor provides real-time analysis of the censorship systems used by Internet Service Providers. It tracks DNS servers currently under examination, lists known DNS servers that respond correctly to specific tests, and produces country reports on the types of blocking detected — from gambling and file-sharing to streaming and image hosting.
- DNS probes
- Country reports
- Injected addresses
- ISP scoring
Coverage across the monitored regions
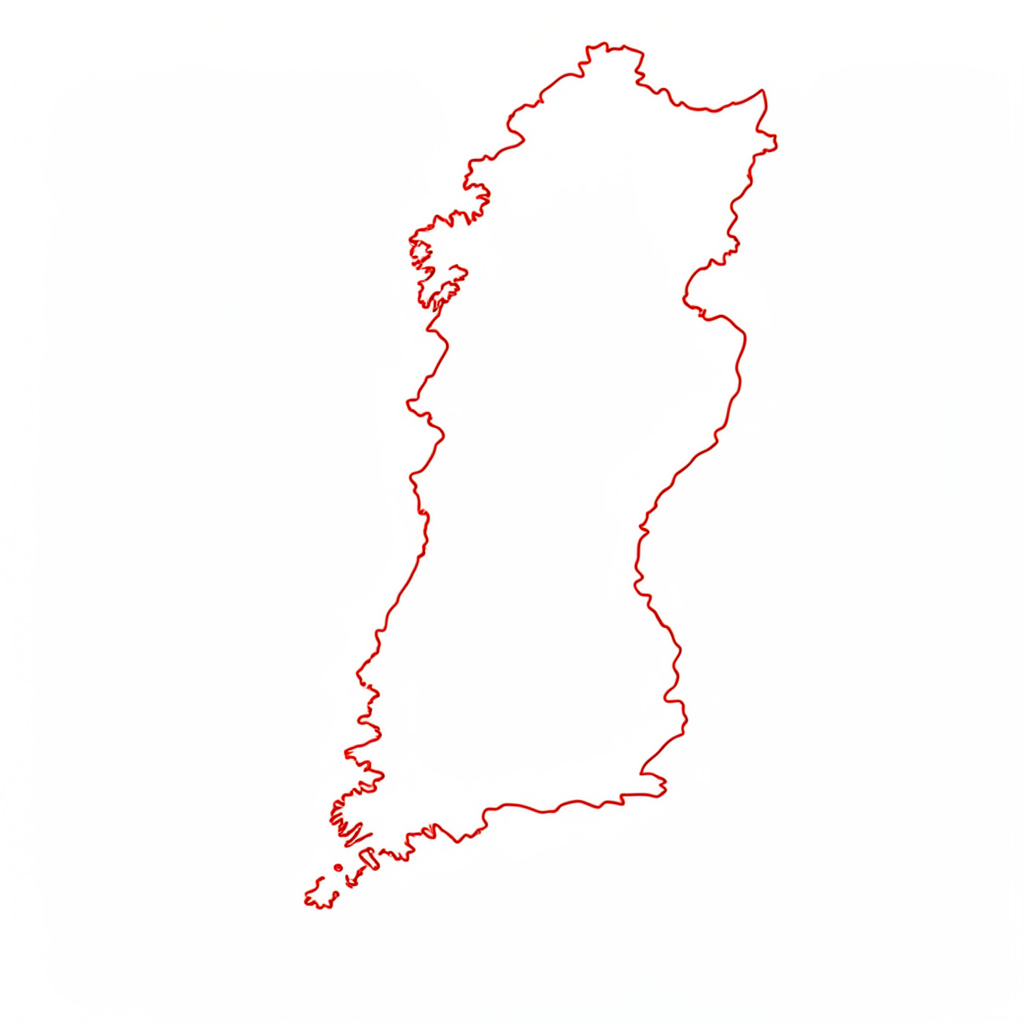
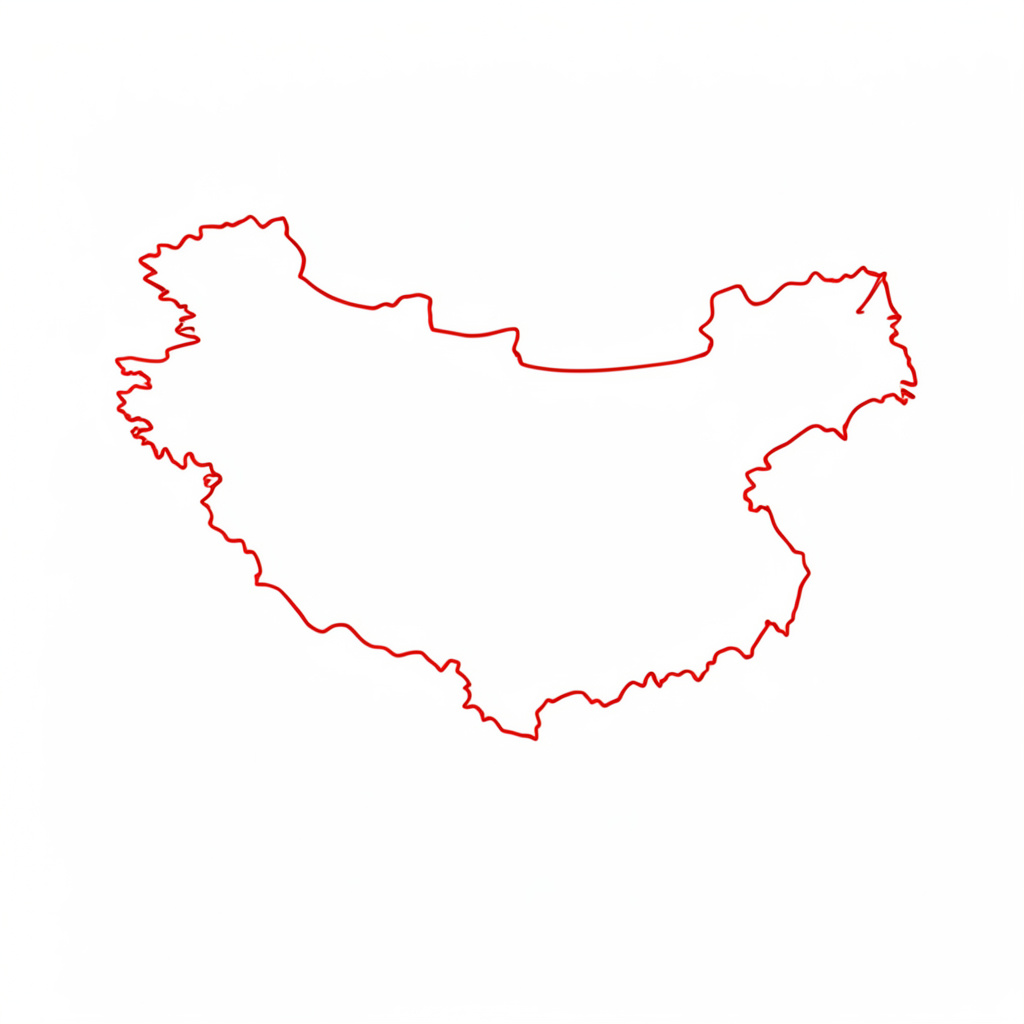
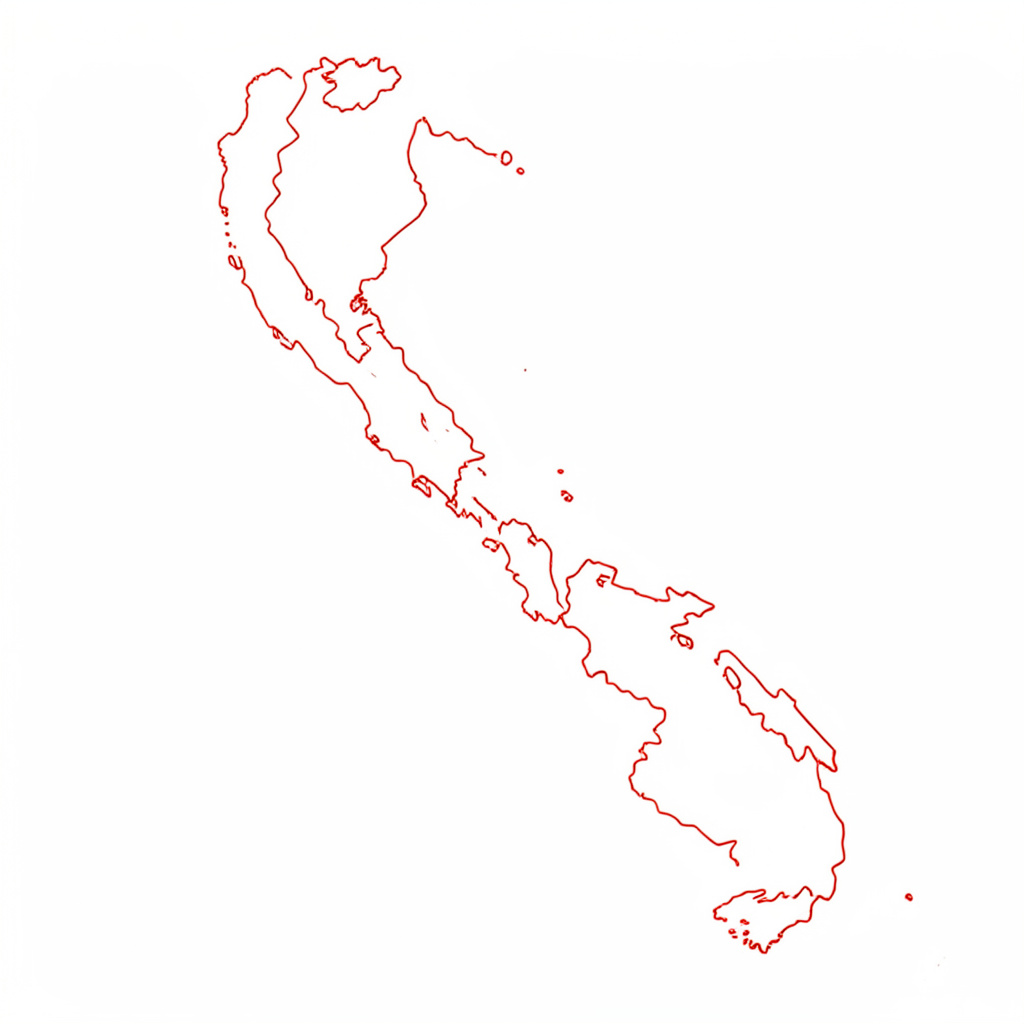
Country reports are available for China, Colombia, Denmark, Estonia, Finland, Italy, Korea Republic of, Sweden, Switzerland, Thailand, Turkey and additional regions as new probes are activated.
- 11+Countries with published reports
- LiveDNS server list under examination
- CC BY 2.5 IT / BY-SA 3.0Content licensing applied
- OpenDonations and probe submissions
Using CSV exports for internet censorship research
Net Neutrality Monitor gives researchers a practical way to examine internet censorship and filtering involving websites, IP addresses, ISPs and DNS servers. Its country reports combine blocked-site observations with blacklist, probe, DNS and statistical records, making them useful evidence for questions that ordinary website tests cannot answer. Using the “Export as CSV” feature for your own analysis therefore starts with recognising that each row is a conditional observation, not a universal verdict.
For an Australian audience, the value lies in turning those records into a dated, reproducible dataset rather than treating a single failed request as proof of blocking. Households in Sydney, Melbourne, Brisbane and Perth often move between fixed broadband, mobile connections and different DNS configurations, while regional users may rely on fixed-wireless or satellite services. Those conditions make careful filtering and comparison especially important.
The project is presented as a beta, volunteer-supported service powered by AirVPN, and its data is supplied for indicative research purposes. Exports should therefore be read as observations within a particular time, place and measurement method, not as a complete national map or a definitive attribution of intent.
Finding and downloading a dataset
Open the relevant country report or blacklist view and locate the Export as CSV control. The comma-separated values file normally represents the records available in that view, so apply the report’s country, address and observation filters before downloading if you want a focused subset. Keep the browser’s date display or report timestamp in your notes because the same hostname can produce different outcomes over time.
Save the file with a descriptive, lowercase name such as au_blacklist_2026-05-18.csv, then work from a copy. Before opening it, check the delimiter, header row and text encoding in a text editor. Detailed instructions appear in How to export our blacklist data for your own research projects, which is useful when reproducing a published export or explaining the method to another researcher.
A download is evidence of what the service displayed, but it is not automatically a verified finding. Retain the original file unchanged, record the page URL, collection time and filters, and calculate a checksum—a short digital fingerprint—if your project needs to show that the analysed copy matches the source. This provenance trail prevents later spreadsheet edits from obscuring where an observation came from.
Reading the columns correctly
Treat each row as an observation and each column as a field defined by the report. Depending on the dataset, fields may identify a hostname, IP address, country, network or DNS-related measurement, status, timestamp or supporting metadata. Read the release notes or field descriptions before renaming anything: labels such as “reachable” and “filtered” can describe a test result without establishing who imposed the restriction.
Before combining exports, check whether two files use the same schema and whether addresses are stored as text, integers or both. Some spreadsheet programs remove leading zeros or convert a long value into scientific notation. Importing through a data tool with explicit column types is safer than double-clicking a CSV when addresses, dates or identifiers must retain their exact form.
Normalise headers only in the working copy, and keep a separate note mapping every old label to the new one. Add derived fields such as observation date, Australian state, network family or resolver category only when the source supports the classification. A reproducible dataset should distinguish measured values from analyst-created variables, especially when the project will be reviewed by someone outside the team.
Building an Australia-focused dataset
Australia’s major retail internet markets include national fixed-line and mobile providers, but their presence and technology vary by location. NBN fixed-line plans, FTTP connections in selected areas, 4G and 5G mobile services, and regional fixed-wireless or satellite options can all shape the path between a device and a tested address. Filtering by provider, connection type and date can prevent one network profile from being presented as the whole country.
State boundaries add another layer because online filtering results can differ geographically even when two users share a provider. For a study centred on Australian behaviour, create separate fields for the observation location and the analyst’s jurisdiction label, then document how missing or ambiguous locations were handled. Where city-level detail is present, compare Sydney with Perth or Melbourne with Brisbane, but avoid inferring state from an IP address unless the method and confidence level are recorded.
The site help pages are the right place to clarify how a control, status or country value is defined before it becomes a research variable. You can also submit a URL or IP address for monitoring and review later country-specific results. Treat that submission as a request for observation rather than an instant verdict, and retain the resulting date so the analysis reflects what was measured.
Cleaning and checking the records
A raw CSV often needs cleaning before it supports a claim. Remove blank rows and exact duplicates only when they are demonstrably duplicate exports; retain repeated observations of one address because they may show change over time. Standardise whitespace, convert timestamps to one timezone, and preserve the original value in an additional field. Report exclusions instead of silently deleting them.
Run checks for unmatched columns, impossible dates, mixed address formats and contradictory status fields. A small random sample should be compared with the corresponding country report, and unusual rows should be traced back to the source view. If a result cannot be reproduced, mark it unresolved rather than rewriting the record to fit the hypothesis.
Interpretation also needs a human context. Workshops with young people or community groups can surface questions that a script cannot, provided participants understand how network observations differ from allegations about people. For projects involving mentoring and women in technology, the Girl Force network is one Australian avenue to explore alongside digital-literacy work. Community feedback should inform study design while leaving technical validation to the underlying measurements.
Research ethics and Australian legal context
A CSV can contain addresses linked to households, organisations or shared infrastructure, so minimise collection and restrict access to working files. Australia’s Privacy Principles under the Privacy Act 1988 may matter when personally identifiable information is present, even if the source is public. Remove unnecessary fields, separate re-identification keys from analytical data, and publish aggregated results where individual observations are not essential.
Network research should also stay within the legal framework that applies to the service and the researcher. The Telecommunications Act 1997, ACMA’s role in internet-service regulation and complaint processes, and the Online Safety Act 2021 may become relevant when results are published or escalated. None of these instruments makes an experimental measurement lawful in every circumstance, so obtain appropriate advice before testing systems you do not operate.
If a project moves from network observation to field work involving drones, treat authorisation as a separate issue from connectivity. Parks can contain protected habitats, and federal and state endangered-species rules may apply alongside local permissions. The drone law guidance explains why operators should check those requirements before flying, rather than assuming a clear mobile signal indicates permission to operate in a sensitive area.
From export to practical findings
Build the final workflow so that the raw download remains immutable and every analytical step is recorded. A simple sequence is to filter in the monitor, export, checksum, clean in a working copy, validate a sample, derive local categories, and generate a summary from the cleaned file. This sequence keeps provenance intact while allowing the working data to change for legitimate analytical reasons.
The following format comparison shows where each file belongs:
| Dataset form | What it preserves | Best suited to | Main caution |
|---|---|---|---|
| Raw CSV export | Original values, headers and row order | Audit and reproducibility | Preserve unchanged and do not hand-edit |
| Clean working file | Standardised fields plus derivation notes | Filtering, joins and statistical checks | Record every transformation |
| Aggregated summary | Counts and rates by selected dimensions | Reporting and comparison | Disclose filters, dates and missing data |
Choose the raw export when another researcher may need to challenge a result, the cleaned file for daily analysis, and the aggregated output for communication. Name each version consistently and record which one produced every chart. If a number comes from a join, include the join rule and row counts before and after it.
Recommendations for a reliable analysis
- Keep the untouched CSV, download metadata and checksum together as the source package.
- Use stable country, provider, status and date fields before creating regional groupings.
- Sample records against the live report and record unresolved discrepancies.
- Store the cleaning script, field dictionary and software versions with the working file.
- Report indicative findings with dates, filters and limitations, without claiming nationwide coverage.
The practical takeaway is to make every statement traceable: an untouched export proves what was collected, the working file shows how it was prepared, and the summary shows exactly what the evidence can support.
Transparent, analytical, community-run
The platform documents how ISPs handle neutrality on the wire, with method notes, country breakdowns and a public blacklist of injected addresses. — Project methodology

Country reports at a glance
Snapshots from the published country reports. Open a tile to view the full regional analysis on the Reports page.