Net Neutrality Monitor analyses how Internet Service Providers resolve, block and inject DNS traffic. The platform tracks servers under examination, surfaces country-level reports, and publishes a live blacklist of injected addresses.
View Country ReportsWhat the platform does
Net Neutrality Monitor provides real-time analysis of the censorship systems used by Internet Service Providers. It tracks DNS servers currently under examination, lists known DNS servers that respond correctly to specific tests, and produces country reports on the types of blocking detected — from gambling and file-sharing to streaming and image hosting.
- DNS probes
- Country reports
- Injected addresses
- ISP scoring
Coverage across the monitored regions
Country reports are available for China, Colombia, Denmark, Estonia, Finland, Italy, Korea Republic of, Sweden, Switzerland, Thailand, Turkey and additional regions as new probes are activated.
- 11+Countries with published reports
- LiveDNS server list under examination
- CC BY 2.5 IT / BY-SA 3.0Content licensing applied
- OpenDonations and probe submissions
Exporting Net Neutrality Monitor Blacklist Data for Research
The Net Neutrality Monitor project publishes continuous measurements of how Australian ISPs and recursive resolvers handle requests to domains that appear on its community-curated blocklists. Researchers at institutions like the University of Melbourne, the Australian National University, and smaller outfits such as the Sydney-based Digital Rights Watch have all relied on the platform's data feeds to compare blocking behaviour across providers like Telstra, Optus, and TPG. Because the project is a beta, volunteer-supported effort, the export workflows are not always documented in one place, so a few practical notes can save a lot of trial and error.
The blacklist dataset is refreshed on a rolling basis as volunteer probers across different countries submit new URLs and IP addresses. Each entry carries metadata about the country of origin, the probing method (DNS resolver or HTTP request), the timestamp, and the category assigned to the domain. For an Australian study, this means you can pull a snapshot showing which gambling, file-sharing, or news domains were unreachable from a Sydney or Melbourne vantage point last week and reproduce the same query in a month to see what has shifted. The raw data sits behind a series of public endpoints, and once you understand the structure the export process becomes repeatable rather than a one-off download.
Working with the data outside the website is straightforward, but only if you treat it like a research artefact rather than a quick spreadsheet. The platform is explicit that the figures are provided for indicative research purposes, so your methodology section should reflect that scope. The remainder of this article walks through the formats available, the practical steps to get the data into a local environment, and a few things worth checking before you publish anything based on the numbers.
What the Blacklist Dataset Actually Contains
The blacklist is not a single flat file. It is a relational collection where each record describes a domain or IP address, the categories it belongs to, the countries where blocking was observed, and the source of the report. Categories span a wide range, from adult content and gambling to education, news, and file sharing. A breakdown of how the education category specifically accumulates entries is described in this category breakdown, which is useful background if your project touches on school filtering or library network policies in the ACT or Victoria.
For Australian researchers, the most useful fields are the country code, the resolver or HTTP endpoint that returned a blocked response, and the confidence level attached to the observation. The confidence field is important because volunteer probers occasionally mark results as inconclusive due to transient network errors, captive portals on hotel wi-fi, or a misconfigured resolver in someone's home lab. Filtering the export on that field before you start counting anything will save a frustrating round of revisions later.
The dataset also includes historical snapshots, which means a longitudinal study is possible without having to scrape the live site repeatedly. If you are working on a thesis that compares blocking patterns between 2024 and 2026, the archived exports let you keep the methodology consistent across years. This is a far cleaner approach than relying on whatever the front-end happens to display on the day you ran your query, and it makes peer review much easier when reviewers ask for the raw inputs.
Choosing an Export Format That Fits Your Workflow
The platform exposes its data in a handful of machine-readable formats. The most common are JSON, CSV, and a tab-separated variant that includes the same fields with a slightly different escaping convention. JSON is the most faithful representation because it preserves nested fields such as category lists and observer metadata, and it is the format most scripting languages handle natively. CSV is easier to drop into pandas, R, or even Excel for a quick visual check, but you will lose the nested structure and may need to flatten the category column yourself.
If you are scripting the export from a Jupyter notebook running on a university cluster in Brisbane or Perth, JSON is usually the safest default. For a colleague who just wants to filter by country code in a spreadsheet, CSV is fine as long as you warn them that the category column will arrive as a pipe-delimited string. The tab-separated variant is mostly there for legacy tools that choke on commas inside quoted fields, and you can safely ignore it unless you are feeding the data into a piece of software that specifically asks for it.
Whichever format you choose, do the export from a stable network connection and cache the response locally. Because the project is volunteer-run, occasional API hiccups are part of the deal, and re-running a half-finished pull at 2am before a deadline is not a fun experience. A simple script that saves the raw response with a timestamp in the filename will let you reproduce any analysis months later without having to ask the maintainers for a manual archive.
Step-by-Step Export Process
The actual export starts on the country page of the website. Select the country you want to study, in this case Australia, and apply the date range that matches your research window. The interface will then offer a download link for the consolidated blacklist slice. If you are comfortable with the command line, the same data is available through a public API endpoint that accepts the country code and date range as query parameters.
A minimal Python snippet using the requests library is enough to authenticate, request the JSON payload, and write it to disk. Once you have the file, a quick schema check with a tool like jsonschema or simply printing the top-level keys will tell you whether the export was complete. Missing keys usually mean the request was rate-limited, and waiting a minute before retrying almost always resolves the issue.
For researchers publishing their work, a working export script kept in a public repository is far more useful than a static spreadsheet. It lets reviewers and other academics in Adelaide, Hobart, or anywhere else run the same pull, verify your numbers, and extend the study to other countries. The Net Neutrality Monitor team is supportive of this kind of reuse as long as the indicative-purpose disclaimer is carried through to the final publication, and any public-facing pilot that grows out of the research should follow a sensible public notice checklist for community transparency.
Cleaning, Filtering, and Joining the Data
Raw blacklist data is rarely ready for analysis the moment it lands. Australian researchers will often want to normalise the country field to the ISO 3166-1 alpha-2 standard, strip whitespace from domain strings, and resolve any punycode entries into their unicode form. Domain strings sometimes arrive with surprising extras, from protocol prefixes and trailing paths to an astrology site that was submitted as a control case, and normalising the field before any aggregation step keeps the counts honest.
Filtering is where local context matters. If you are replicating an ACMA-style study, you will want to keep only entries flagged as observed by Australian resolvers and discard observations from other countries even if the domain appears in the global slice. Joining the data with your own traceroute measurements or with the blocking method comparison discussed in a recent Neumon article can give you a much richer picture than either source alone.
Joining external datasets is also where schema drift can bite you. A new release of the blacklist might add a field or rename an existing one, and a hard-coded column reference will silently produce nulls instead of failing loudly. A defensive loader that inspects the keys on every import is a small investment that pays off the first time the maintainers push a structural change, particularly for projects that pull data nightly from a server in a regional data centre.
Common Pitfalls and How to Avoid Them
The single most common mistake is treating the blacklist as a definitive list of every blocked domain in Australia. It is not. The dataset reflects what volunteer probers could see from their vantage points at specific times, and coverage is uneven. A small ISP in regional Queensland might have no observations at all, which is worth stating in your methodology rather than papering over.
Another pitfall is ignoring the time zone. Prober timestamps are stored in UTC, but Australian researchers will often think in AEST or AEDT, and an off-by-one-hour error in a time-series plot is embarrassingly easy to introduce. Always convert at the visualisation stage rather than at the import stage so that the raw export remains comparable with other research groups working across different states.
Finally, do not forget to read the platform's terms of use. The data is provided for indicative research purposes, and any commercial product or surveillance application built on top of it would be a clear violation of the project's intent. A short acknowledgement in your paper goes a long way toward keeping a small, useful service running for the next cohort of honours students.
| Format | Strengths | Weaknesses | Best for |
|---|---|---|---|
| JSON | Preserves nested fields, easy to parse in most languages | Larger files, harder to inspect visually | Scripted analysis, longitudinal studies |
| CSV | Works in Excel and pandas, small file size | Flattens categories, quoting issues | Quick visual checks, small samples |
| TSV | Handles embedded commas cleanly | Rarely needed, unfamiliar to many tools | Legacy pipelines, specific log analysis tools |
| API stream | Always current, no manual downloads | Requires authentication handling, rate limits | Dashboards, continuous monitoring |
Practical Habits for Reusable Exports
- Save the raw response with a timestamp in the filename before any transformation.
- Document the country code, date range, and API version inside the saved file.
- Keep the export script in a version-controlled repository alongside your analysis code.
- Pin the library versions used to fetch the data so that future runs are reproducible.
Things to Double-Check Before Publication
- That the confidence field has been filtered to remove inconclusive observations.
- That the country field matches the ISO code used elsewhere in your paper.
- That the licence and indicative-purpose disclaimer are acknowledged in the methods section.
- That domain strings have been normalised and deduplicated before any count is reported.
The cleanest way to start is to run a small export of just the Australian slice for the last 30 days, load it into a notebook, and confirm that the schema matches what you expect. Once that round-trip works end to end, you can extend the date range, add the longitudinal archive, and plug the data into the rest of your analysis pipeline without having to revisit the export logic.
Transparent, analytical, community-run
The platform documents how ISPs handle neutrality on the wire, with method notes, country breakdowns and a public blacklist of injected addresses. — Project methodology

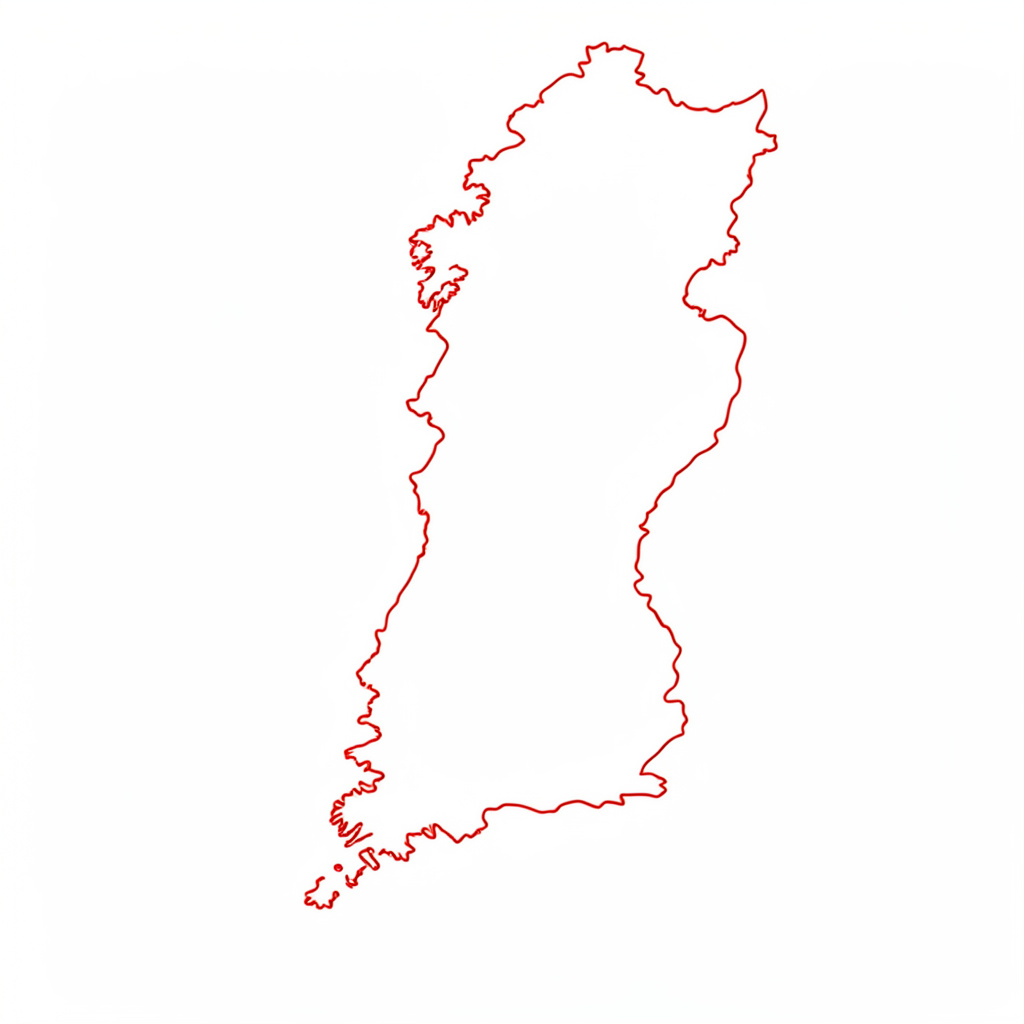
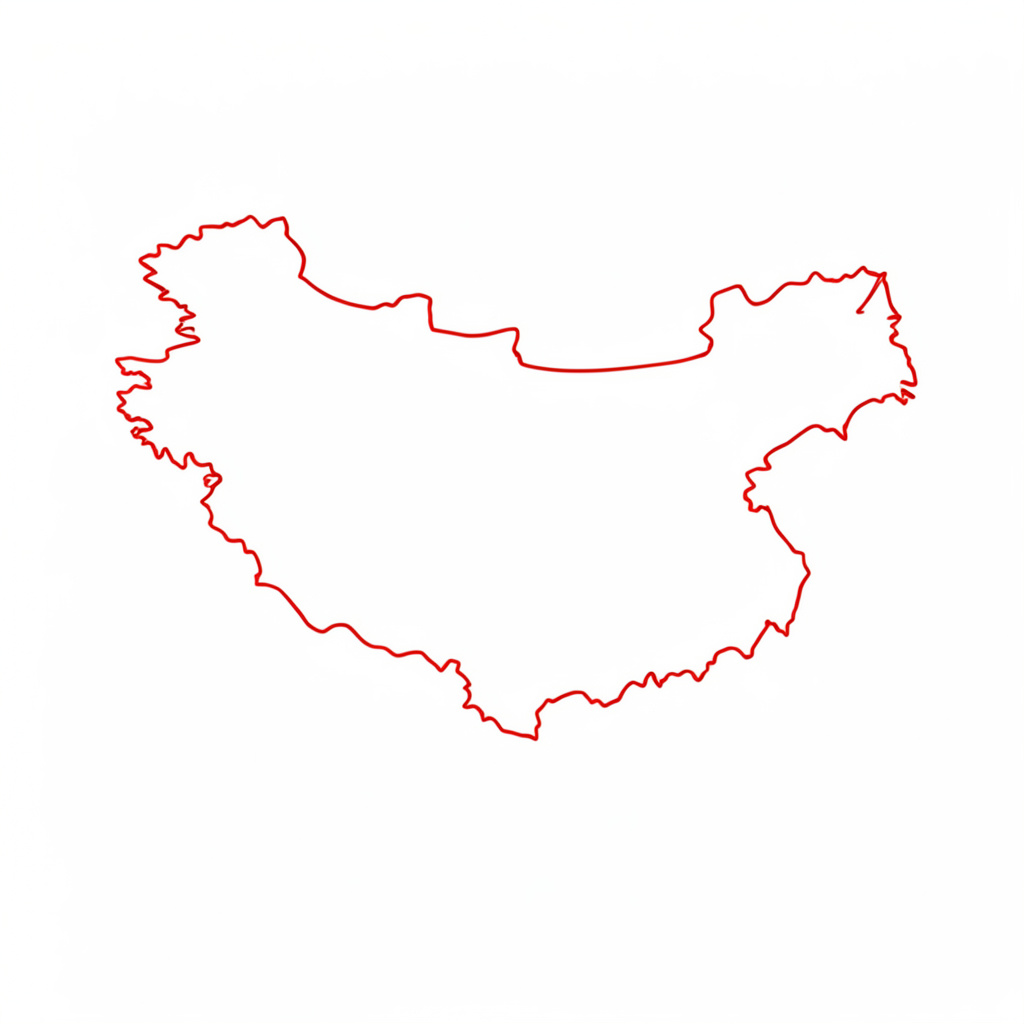
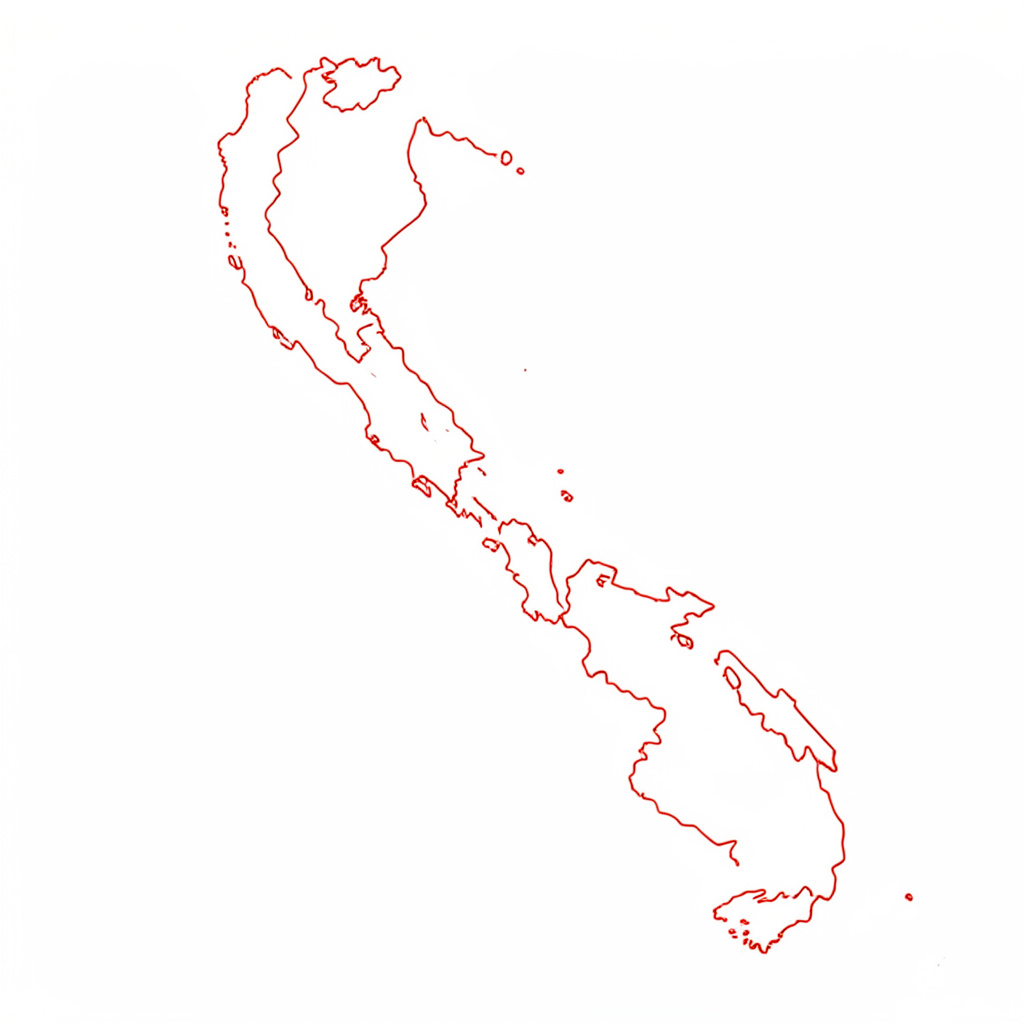
Country reports at a glance
Snapshots from the published country reports. Open a tile to view the full regional analysis on the Reports page.