Net Neutrality Monitor analyses how Internet Service Providers resolve, block and inject DNS traffic. The platform tracks servers under examination, surfaces country-level reports, and publishes a live blacklist of injected addresses.
View Country ReportsWhat the platform does
Net Neutrality Monitor provides real-time analysis of the censorship systems used by Internet Service Providers. It tracks DNS servers currently under examination, lists known DNS servers that respond correctly to specific tests, and produces country reports on the types of blocking detected — from gambling and file-sharing to streaming and image hosting.
- DNS probes
- Country reports
- Injected addresses
- ISP scoring
Coverage across the monitored regions
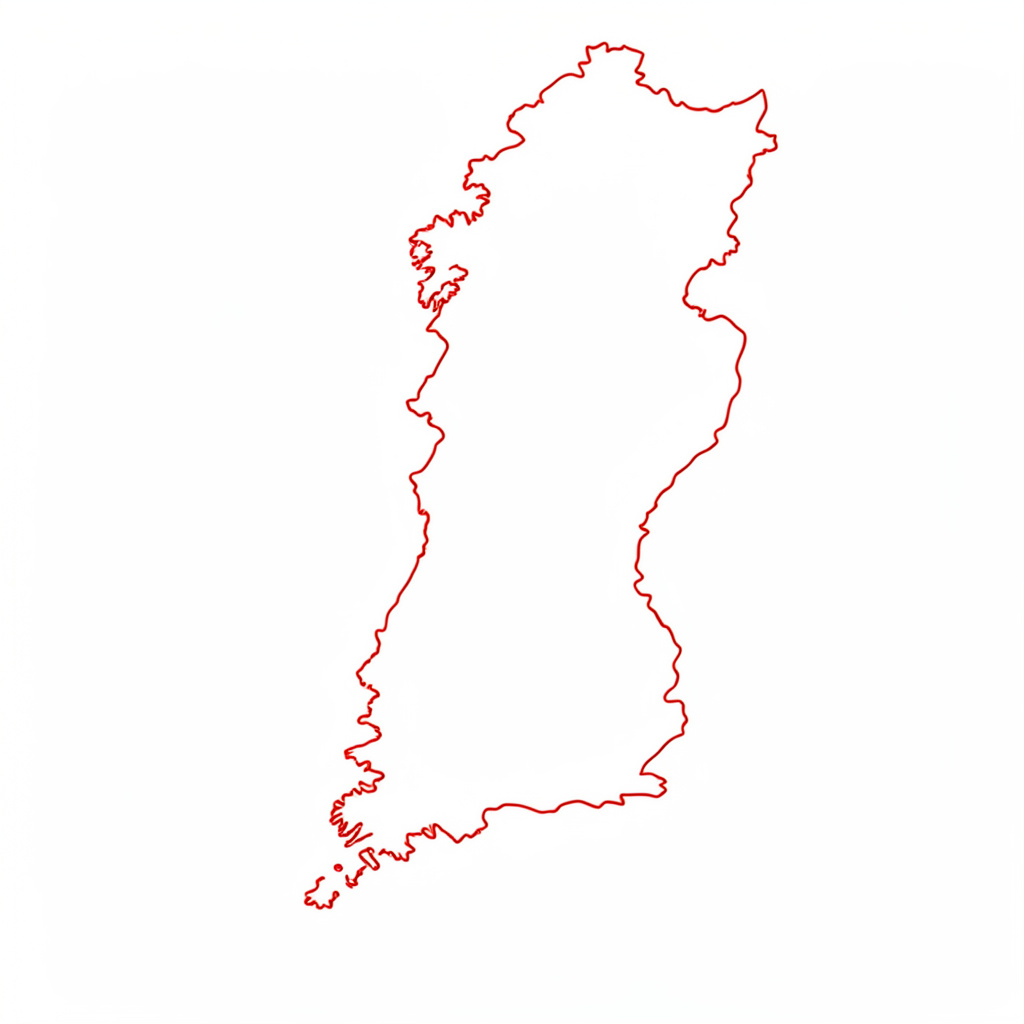
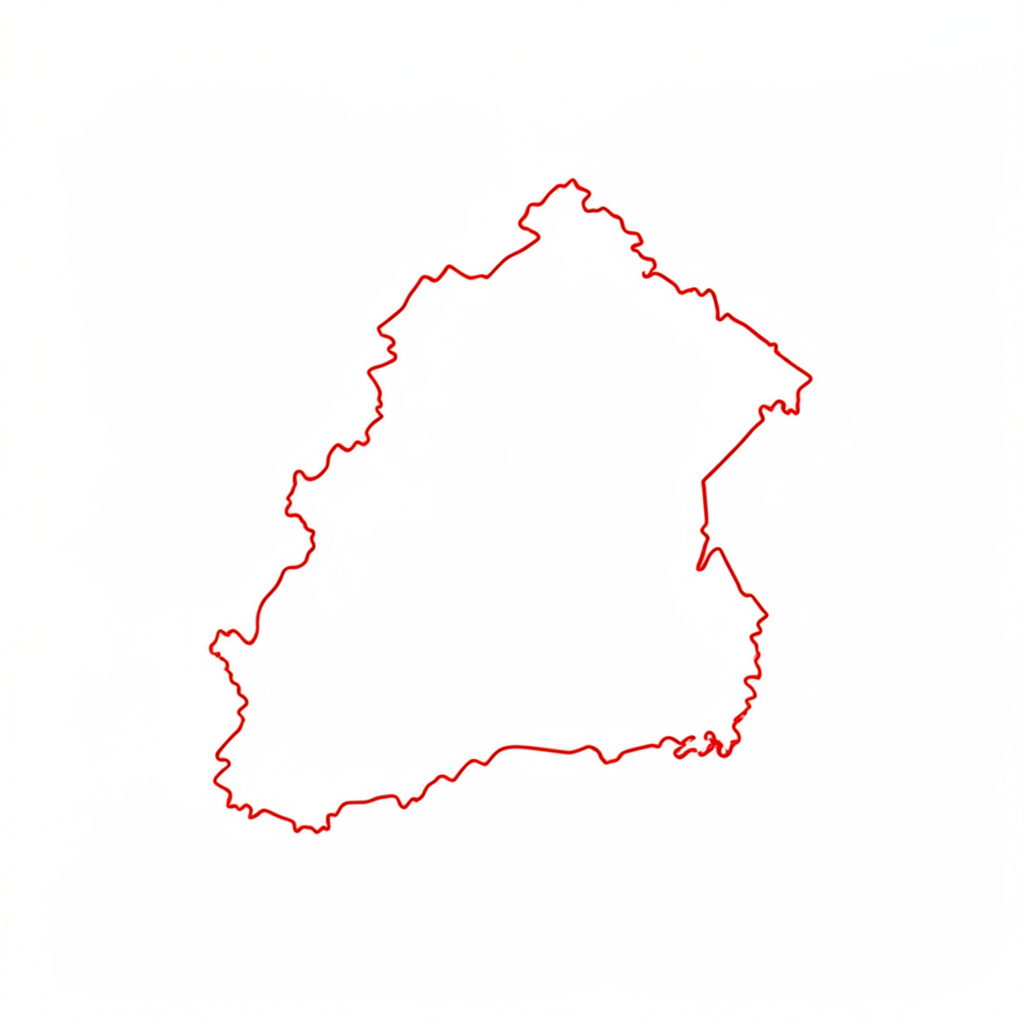
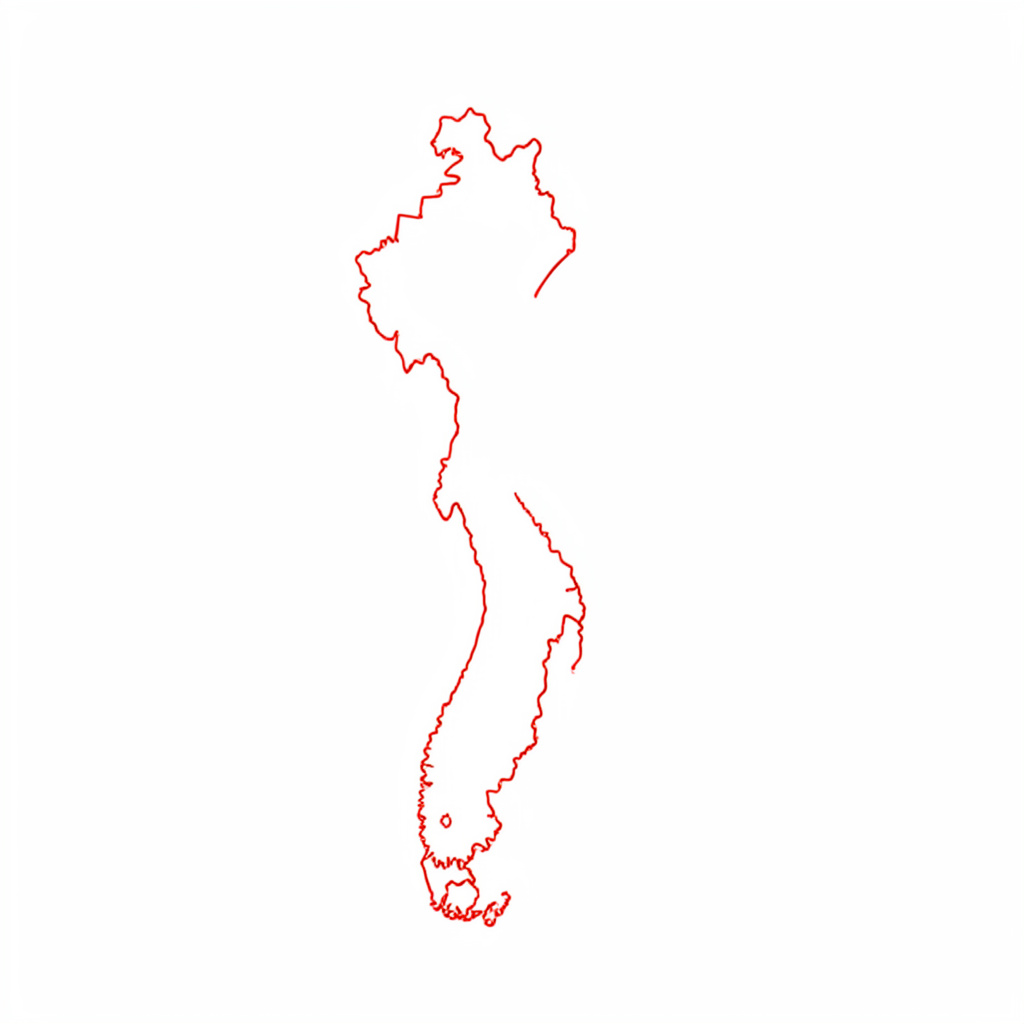
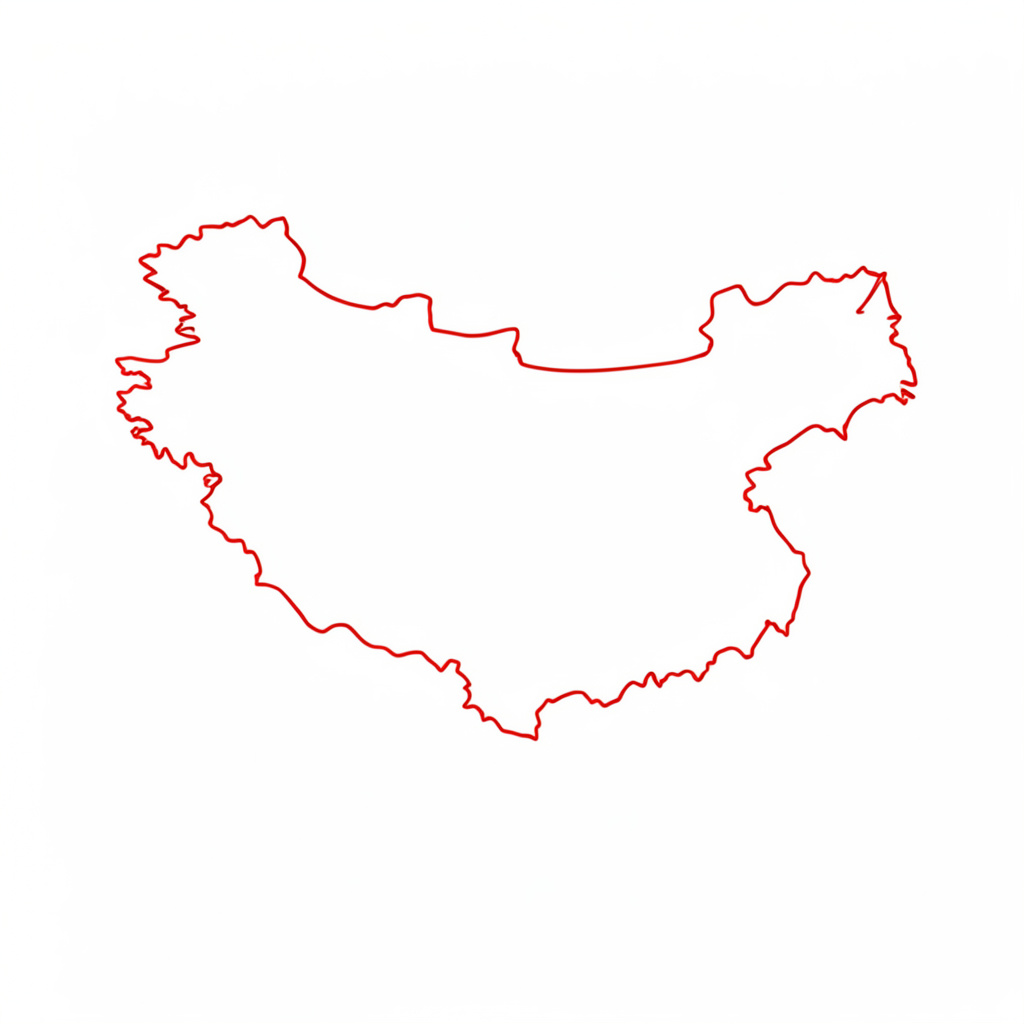
Country reports are available for China, Colombia, Denmark, Estonia, Finland, Italy, Korea Republic of, Sweden, Switzerland, Thailand, Turkey and additional regions as new probes are activated.
- 11+Countries with published reports
- LiveDNS server list under examination
- CC BY 2.5 IT / BY-SA 3.0Content licensing applied
- OpenDonations and probe submissions
How international shutdowns reshape the way we track censorship
Internet shutdowns have moved from being a regional concern handled by a handful of human rights groups to a global phenomenon that touches nearly every corner of the network. From election days in Africa to protest movements in South Asia, governments now reach for the kill switch as a first resort rather than a last. Net Neutrality Monitor has spent years collecting probes and DNS data from volunteer-run servers, and the picture that emerges when we compare years of logs is unmistakable: the international shutdown has become the dominant unit of political expression on the modern web.
For an Australian reader, the phrase "internet shutdown" still sounds like something that happens elsewhere. We picture generals cutting fibre before a vote, or a state going dark during exam season. Yet the technical reality is that an Australian consumer on a domestic NBN connection is only one routing change away from the same kind of disruption. The infrastructure that allows a user in Sydney to reach a website hosted in Frankfurt is the same infrastructure that a foreign regulator can sever, reroute, or filter. Understanding this shared backbone is what made us start publishing country-level statistics in the first place.
Australia also sits at an interesting junction. The country has some of the strongest consumer protections for telecommunications in the developed world, and the Australian Communications and Media Authority publishes detailed codes about what ISPs must and must not block. At the same time, the sheer volume of data our Australian probes collect shows that a meaningful slice of cross-border filtering is invisible to the end user. Pages simply do not load, or they load with errors that look like network problems, and the average person blames their home router. The work of an open censorship monitor is to lift the curtain on that experience.
Why international shutdowns matter to a volunteer monitoring project
The most common misconception about internet shutdowns is that they are blunt instruments. A government pulls the plug, traffic stops, and that is the end of the story. The data we have gathered tells a different tale. Shutdowns are layered. They begin with throttling of specific platforms, escalate to DNS poisoning, then move on to IP-level blocking, and only in the most extreme cases reach a full fibre cut. Each layer produces a different fingerprint in our probe logs, and recognising the fingerprint is what lets us attribute the event to a specific policy decision rather than a hardware failure.
The second misconception is that a shutdown in one country stays in that country. Once a major cloud provider goes dark, the collateral damage spills into hosted services used by foreign businesses, diaspora communities, and even tourists. Australian travellers in affected regions, including aid workers and engineers, suddenly find that their corporate VPNs will not connect. The data that reaches our servers in those moments often comes from a curious mix of professional and personal users who, in the absence of normal connectivity, fire up whatever workaround they can find. Researchers have begun to notice that the same fragility affects rural development projects. One recent digital payment research effort used our country-level reachability numbers to argue that subsidy delivery is more brittle than commonly assumed, because the payment platforms sit on the same infrastructure that gets filtered during political unrest.
A third pattern we see is the regulatory export of censorship. When a country develops a sophisticated filtering apparatus, the same vendors often pitch that apparatus to neighbouring states. The technical signatures of those filtering boxes are recognisable across borders, and they show up in our cross-country comparison reports. For researchers interested in the political economy of shutdowns, the ability to track a single vendor's hardware across multiple jurisdictions is one of the more valuable by-products of our work.
How our probe network captures cross-border filtering
Net Neutrality Monitor is, at heart, a federation of small probe nodes that run continuously from volunteer homes and small server rooms. Each probe attempts to resolve a curated list of domains against multiple DNS resolvers, then measures the round-trip time and response code when it tries to reach the resolved IP. When something changes in the chain, the probe flags the anomaly and forwards the result to our central analysis pipeline. The system was designed to be light enough to run on a Raspberry Pi tucked behind a router in Adelaide or Perth.
The blacklist side of the project works in the opposite direction. Users from any country can submit a URL or an IP address for review, and our volunteers check whether the resource is reachable from a range of vantage points. Submissions pour in from researchers, journalists, and ordinary citizens who suspect that a site they care about is being quietly filtered. We cross-check those submissions against the probe data, and when the two agree, we publish a country-level entry in our reports. The result is a living map of what is reachable where, refreshed several times a day.
Because the platform is powered by AirVPN and supported by volunteers, we have made an early decision to publish raw data alongside our analyses. Anyone can download a CSV of our DNS probes, audit our methodology, and run their own statistics. For Australians who want to see how the open web looks from Brisbane compared with Berlin or Buenos Aires, the download is the easiest way to satisfy that curiosity.
Where Australia fits in the global picture
Australia does not appear in our statistics as a country that imposes shutdowns. The legal framework, including the Telecommunications Act and the various determinations issued by ACMA, treats the network as essential infrastructure that can be lightly filtered in narrow circumstances, such as the court-ordered blocking of overseas gambling sites that breach the Interactive Gambling Act. Beyond those targeted blocks, the Australian internet is unusually open by regional standards, and that openness is reflected in our probe data. Median reachability scores for Australian vantage points sit within a few percentage points of the global median. Researchers studying the local market have used our data to map exactly which offshore platforms are caught by the blocklists, and one safe online casino audit pulled probe data from our platform to show how reachability differs between Sydney, Melbourne, and Perth.
What Australia contributes, however, is a high-quality vantage point for watching what happens elsewhere. A probe located in Sydney sees the world through undersea cables that land at Coogee Beach and at Torquay. Those cables carry most of the country's international traffic, and they are also the first point at which a foreign filtering rule can be applied. When we see anomalous drops in reachability for domains hosted in South or Southeast Asia, our Australian probes often flag the issue hours before our European nodes do. That lead time has proved useful for journalists working on tight deadlines.
A second contribution is the policy conversation. Australian civil society groups have used our data to argue against the kind of catch-all site blocking regimes that have spread through parts of Europe and Asia. The argument, made most clearly in submissions to parliamentary inquiries in Canberra, is that blocking lists age badly, sweep in legitimate services, and rarely achieve their stated policy goal. By pointing to the international data, Australian advocates can show their MPs what the long-term consequences look like in countries that adopted similar measures years ago.
Comparing how different projects measure shutdowns
| Project | Primary data source | Coverage | Update cadence | Open data |
|---|---|---|---|---|
| Net Neutrality Monitor | Volunteer probes, DNS queries, blacklist submissions | 40+ countries, volunteer-driven | Continuous, several times per day | Yes, CSV and API |
| OONI | Local apps running on user devices | 200+ countries | User-initiated tests | Yes, JSON |
| Cloudflare Radar | Aggregated traffic from Cloudflare network | Global, all countries | Real time dashboards | Limited, aggregated |
| Access Now #KeepItOn | Incident reports, civil society submissions | Focused on shutdown events | Manual reports after events | Yes, public dataset |
A side-by-side comparison is not meant to crown a winner. Each project looks at the problem from a different angle, and we routinely cross-reference their findings with our own. Where Access Now provides the narrative arc of a shutdown and OONI offers cryptographic evidence from the user side, Net Neutrality Monitor contributes the long-running, low-level baseline that makes sudden changes visible. Game designers have also started to draw on the same datasets. One auto-collect feature review of online slot mechanics used our reachability logs to confirm how a withdrawal flow performs for users in markets where the parent site is on a blocklist. For an Australian researcher writing about regional connectivity, the practical value is in combining all four sources of evidence.
Shutdown triggers and patterns we keep seeing
The most common reasons that appear in our logs, when we can attribute a filtering event to a policy cause rather than a technical one, fall into a handful of categories. These categories have remained remarkably stable across the years we have been collecting data, even as the specific events change.
Categories of filtering we most often record:
- Political events such as elections, protests, or anniversaries of contested historical moments
- Exam seasons in countries where large-scale cheating is feared, with mobile internet throttled around test centres
- Platform-specific blocks aimed at messaging apps, often framed as national security responses
- Court-ordered blocking of online gambling and other regulated services
The first three categories are the textbook international shutdowns, the ones that make headlines in The Guardian Australia and on the ABC. The fourth is more interesting from a technical standpoint because it rarely involves a full disconnection. ISPs are required to make certain services unreachable for their customers, and the way they do that varies wildly. Some use DNS poisoning, some use BGP routing tricks, and a few use deep packet inspection devices that sit in the path between the customer and the international gateway. We have watched vendors pitch the same DPI box to gambling regulators in one country and to political speech regulators in another, with only the configuration file changing.
The artefacts we publish for each country reflect that same variety. Most country pages include the following:
- A rolling chart of reachability scores drawn from volunteer probes
- A list of domains that resolved successfully at the time of the last probe
- A submission log of URLs flagged by users as unreachable, with independent confirmation
- Links to the raw CSV so that anyone can run their own statistics
The most rigorous work on Megaways Pai Gow Poker reachability that we have seen pulls probe data from our platform alongside traffic statistics to map how the player pool shifts in the hours after a major block is enforced.
What an Australian reader should take away from all of this is straightforward. The next time a news story describes a government cutting its citizens off from the global internet, the technical apparatus that makes that cut possible is not mysterious, and it is not confined to the country in the headline. The cables, the filtering boxes, the DNS resolvers, and the legal instruments that enable a shutdown in one place are the same ones that an Australian ISP uses every day to satisfy far narrower local rules. Watching the international shutdown, in other words, is the most honest way to understand the censorship infrastructure that quietly surrounds us at home. The more vantage points we have reporting into a shared dataset, the easier it is to recognise the moment when a routine block becomes something more sweeping, and to give citizens, journalists, and policymakers the early warning they need.
Transparent, analytical, community-run
The platform documents how ISPs handle neutrality on the wire, with method notes, country breakdowns and a public blacklist of injected addresses. — Project methodology

Country reports at a glance
Snapshots from the published country reports. Open a tile to view the full regional analysis on the Reports page.