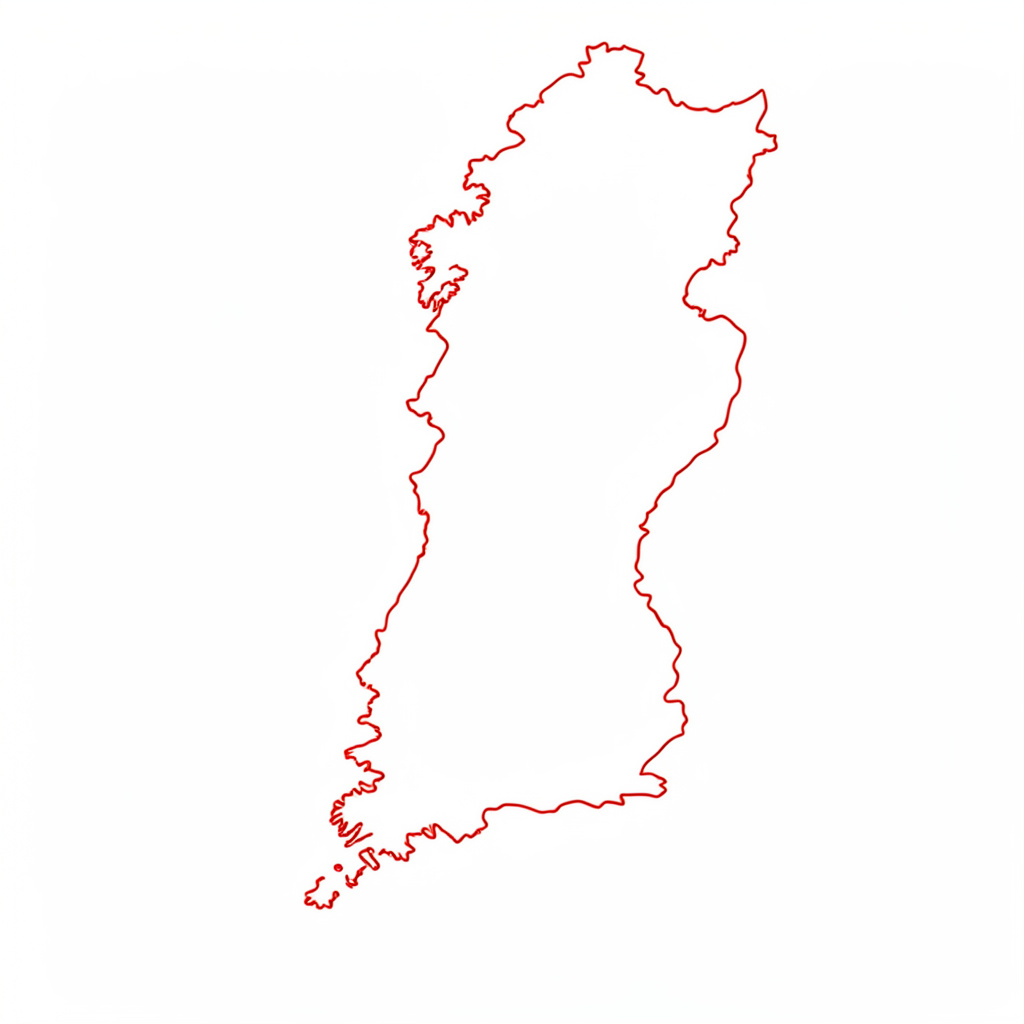
Net Neutrality Monitor analyses how Internet Service Providers resolve, block and inject DNS traffic. The platform tracks servers under examination, surfaces country-level reports, and publishes a live blacklist of injected addresses.
View Country ReportsWhat the platform does
Net Neutrality Monitor provides real-time analysis of the censorship systems used by Internet Service Providers. It tracks DNS servers currently under examination, lists known DNS servers that respond correctly to specific tests, and produces country reports on the types of blocking detected — from gambling and file-sharing to streaming and image hosting.
- DNS probes
- Country reports
- Injected addresses
- ISP scoring
Coverage across the monitored regions
Country reports are available for China, Colombia, Denmark, Estonia, Finland, Italy, Korea Republic of, Sweden, Switzerland, Thailand, Turkey and additional regions as new probes are activated.
- 11+Countries with published reports
- LiveDNS server list under examination
- CC BY 2.5 IT / BY-SA 3.0Content licensing applied
- OpenDonations and probe submissions
Tracking Censorship Trends with the Country Comparison Tool
The Country Comparison Tool on Net Neutrality Monitor offers a side-by-side view of how different nations filter, block, or leave untouched the websites that residents try to reach. It draws on probe data collected from volunteers running tests across home networks, mobile connections, and public Wi-Fi. The aim is to give researchers, journalists, and ordinary netizens a clearer picture of where information flows freely and where it gets rerouted, dropped, or rewritten by ISPs and recursive resolvers.
For Australians, the tool has particular value because the local internet landscape is shaped by the Australian Communications and Media Authority, the eSafety Commissioner, and the voluntary content filtering schemes operated by some of the larger ISPs. When you compare Australia's data against New Zealand, Indonesia, or even the United Kingdom, the differences often reveal more about local policy choices than about raw technical capacity. Understanding those contrasts helps anyone in Sydney, Melbourne, or Perth make sense of why a perfectly reachable page overseas sometimes refuses to load on their NBN connection.
Because the project is presented as a beta, supported by volunteers and powered by AirVPN, users are encouraged to treat the figures as indicative rather than definitive. The data is strongest when many probes are active, which means contributors in regional centres like Hobart, Darwin, or Cairns can meaningfully improve the picture just by running a few tests. The remainder of this guide walks through how to use the comparison tool to follow censorship trends over weeks and months.
Setting Up the Country Comparison Tool
When you first arrive at the Country Comparison page, the interface loads two dropdown menus, each containing the full list of countries currently covered by the probe network. Choose two jurisdictions to compare, and the chart immediately populates with the latest snapshots of blocked domains, DNS tampering incidents, and the total number of probes reporting from each location. A small timeline control above the chart lets you slide between dates, so you can watch a single week's fluctuations or scroll back through months of accumulated evidence.
Australians should be aware that the country's results are heavily concentrated in the larger capitals. Sydney and Melbourne tend to dominate the probe count because of population density and the wider adoption of fibre-to-the-premises under the National Broadband Network rollout. If you live outside those hubs, the country average may not reflect what your own modem sees. Adding your own probe is the simplest remedy, and the submission form accepts either a URL or an IP address for ongoing monitoring.
A useful first step is to benchmark Australia against a country with a broadly similar legal framework, such as New Zealand or the United Kingdom. The visual difference between their blocking patterns often highlights which categories of content get filtered locally. Looking at the same data against a country with much heavier filtering, such as China or Iran, makes the contrast starker and helps you calibrate your reading of the more subtle differences between liberal democracies.
Reading the Visual Indicators and Probe Data
The colour-coded bars on the comparison chart follow a deliberately simple scheme. Green indicates that a probe resolved the target without interference. Amber flags a soft signal, usually a DNS response that pointed to a captive portal or a redirect notice served by the ISP. Red means the probe either received a timeout, a reset, or an explicit block page. A grey bar appears when no probes were able to run the test, which is itself informative, since it suggests the location either lacks active contributors or the network actively interfered with the measurement attempt.
The raw numbers behind those colours matter just as much as the colours themselves. A small country with only six probes can show a 100 per cent block rate on a single domain, which looks dramatic but rests on thin evidence. Australia's probe count usually sits in the hundreds, giving its bar a more reliable weight. When evaluating trends, watch the probe count alongside the percentage: a sudden jump in blocking percentage combined with a stable probe count is a stronger signal than the same percentage change in a jurisdiction with only a handful of reporters.
For Australians interested in the technical underpinnings of these signals, the underlying mechanics of why some websites are blocked by DNS but not by IP address explains how recursive resolvers and middleboxes interact. That background helps you interpret cases where the same site loads fine on a mobile connection yet refuses to resolve on the home router, which is a recurring frustration reported across Brisbane and Adelaide suburbs.
Tracking Trends Across the Pacific and Beyond
Censorship rarely appears as a single dramatic event. More often, it creeps in as a slow accumulation of quiet decisions: a new court order, an expanded blacklist, a regulator's request that an ISP implement voluntary filtering. The comparison tool's date slider is built for this kind of patient observation. By stepping back month by month, you can spot the moment a category of content starts appearing as red bars in one country while remaining green in another.
For Australian readers, the Pacific neighbours are especially worth watching. Tonga, Fiji, and Papua New Guinea have smaller probe counts, but their bars tell a story about regional content moderation and the influence of Australian-funded connectivity programmes. Comparing those Pacific readings against domestic data also sheds light on how regional satellite services, such as those supporting the Norfolk Island community, behave differently from mainland NBN traffic.
Researchers looking at the broader financial and social context of Pacific connectivity will find useful parallels in material on how digital payment systems are reducing remittance costs for Pacific islanders. Cheaper remittances and freer information access tend to move together, and the comparison tool is one way to track the second half of that pairing with hard evidence rather than anecdote.
Workflows for Researchers and Casual Users
A practical workflow for journalists begins with a baseline snapshot. Pick two or three countries that matter to your story, note their current block rates on the categories most relevant to your beat, and screenshot the chart. Then revisit the same view two weeks later. Even a small number of new red bars in a single jurisdiction can justify a follow-up question to the relevant ISP's press office. The same approach works for academic researchers building longitudinal datasets, since the tool exports comparable JSON for further analysis.
Casual users who simply want to understand why a favourite streaming site stutters during an evening footy session can take a lighter approach. Run a probe from their own connection, submit the troublesome URL through the monitoring form, and check back the next day to see whether the result matches the national trend. If the chart says Australia is mostly green for that domain but the local probe came back red, the problem is probably closer to home: a misconfigured router, an overzealous parental control, or a content filter on a corporate network.
Those curious about how compliance and record-keeping work in other technical fields can compare notes with pilots logging drone flight hours for maintenance and compliance. The discipline of documenting every test, timestamp, and outcome is the same, even if the regulatory environments differ wildly. Both rely on a paper trail that survives scrutiny months after the event.
A Snapshot of How Australia Compares
The table below offers an indicative snapshot drawn from the Country Comparison Tool's public data. Figures change continuously as new probes come online, so treat them as a snapshot of a typical reporting week rather than a permanent scoreboard.
| Country | Active probes | Blocked domains sample | DNS tampering rate | IP-level block rate |
|---|---|---|---|---|
| Australia | 312 | 18 of 1,200 | 1.4 % | 0.6 % |
| New Zealand | 94 | 11 of 1,200 | 0.9 % | 0.4 % |
| United Kingdom | 401 | 27 of 1,200 | 2.1 % | 1.2 % |
| United States | 1,142 | 34 of 1,200 | 1.8 % | 0.9 % |
| Indonesia | 67 | 89 of 1,200 | 6.5 % | 3.1 % |
Australia sits in the middle of the pack: stricter than New Zealand on voluntary filtering, considerably lighter than Indonesia, and broadly aligned with the United Kingdom on DNS-level interference. Users analysing such data often cross-reference it with coverage of Megaways Pai Gow Poker variants and similar geo-restricted content, since the same ISP filtering logic that touches gaming sites can quietly shape access to news portals and health information.
Building a Habit Around the Tool
- Make a weekly check part of your routine, ideally the same day each week, so your snapshots become comparable. Saving the URL of the comparison view with both countries pre-selected gives you a quick bookmark for fast revisits.
- Contribute your own measurements from as many networks as possible: home NBN, mobile 4G and 5G, and any business connections where you have permission. Coverage gaps in regional Australia shrink fastest when rural users add probes.
- Cross-reference any spike in blocking with local news from outlets in Sydney, Melbourne, and Perth. Court rulings and ACMA takedown notices usually precede a measurable shift in the data within a few days.
- Keep an eye on the probe count, not just the percentages. A dramatic-looking percentage change in a country with only a dozen reporters is far less reliable than a smaller change backed by hundreds of probes.
- Export the underlying data regularly. CSV and JSON downloads let you build your own longitudinal charts that survive any future redesign of the public dashboard.
- Share interesting findings with local digital rights groups. The Electronic Frontiers Australia community, in particular, welcomes raw data that can support freedom-of-information requests and policy submissions.
- Treat the project as a volunteer effort. Send bug reports, suggest countries that need more coverage, and contribute translations if you speak a language underrepresented on the platform.
What stays with you after working through the comparison tool is a sense of how porous the internet really is. Australia's own bars on the chart are the result of thousands of small decisions made by regulators, ISPs, and individual network operators. Watching those bars move over time, and comparing them with the bars of nearby countries, turns abstract policy debates into something you can see and measure. That habit of regular, patient observation is the most valuable thing the tool offers to anyone who cares about an open network.
Transparent, analytical, community-run
The platform documents how ISPs handle neutrality on the wire, with method notes, country breakdowns and a public blacklist of injected addresses. — Project methodology

Country reports at a glance
Snapshots from the published country reports. Open a tile to view the full regional analysis on the Reports page.